Performance Profiling a Redux App
Redux is pretty fast by default, but when you're trying to optimize you need to know where time is spent. This middleware will help you identify slow or redundant code paths.
Posted , 2 minute read.(image credit: Goh Rhy Yan)
Redux apps are generally pretty easy to optimize for performance. Redux is default-fast, to an extent. By enforcing immutability, it offers a lot of areas for simple optimizations by === equality checks. Simple equality checks means it's easy to memoize functions, allowing your app to avoid redundant work.
The hard part of optimization within large applications is finding out what parts of your code are the most expensive to run. The Chrome devtools offers pretty advanced profiling tools that help you analyze your code, but it can be difficult to tell the difference between the code you've written and the code that comes from libraries.
Below is a flame chart from the real-world Redux example after submitting a search.
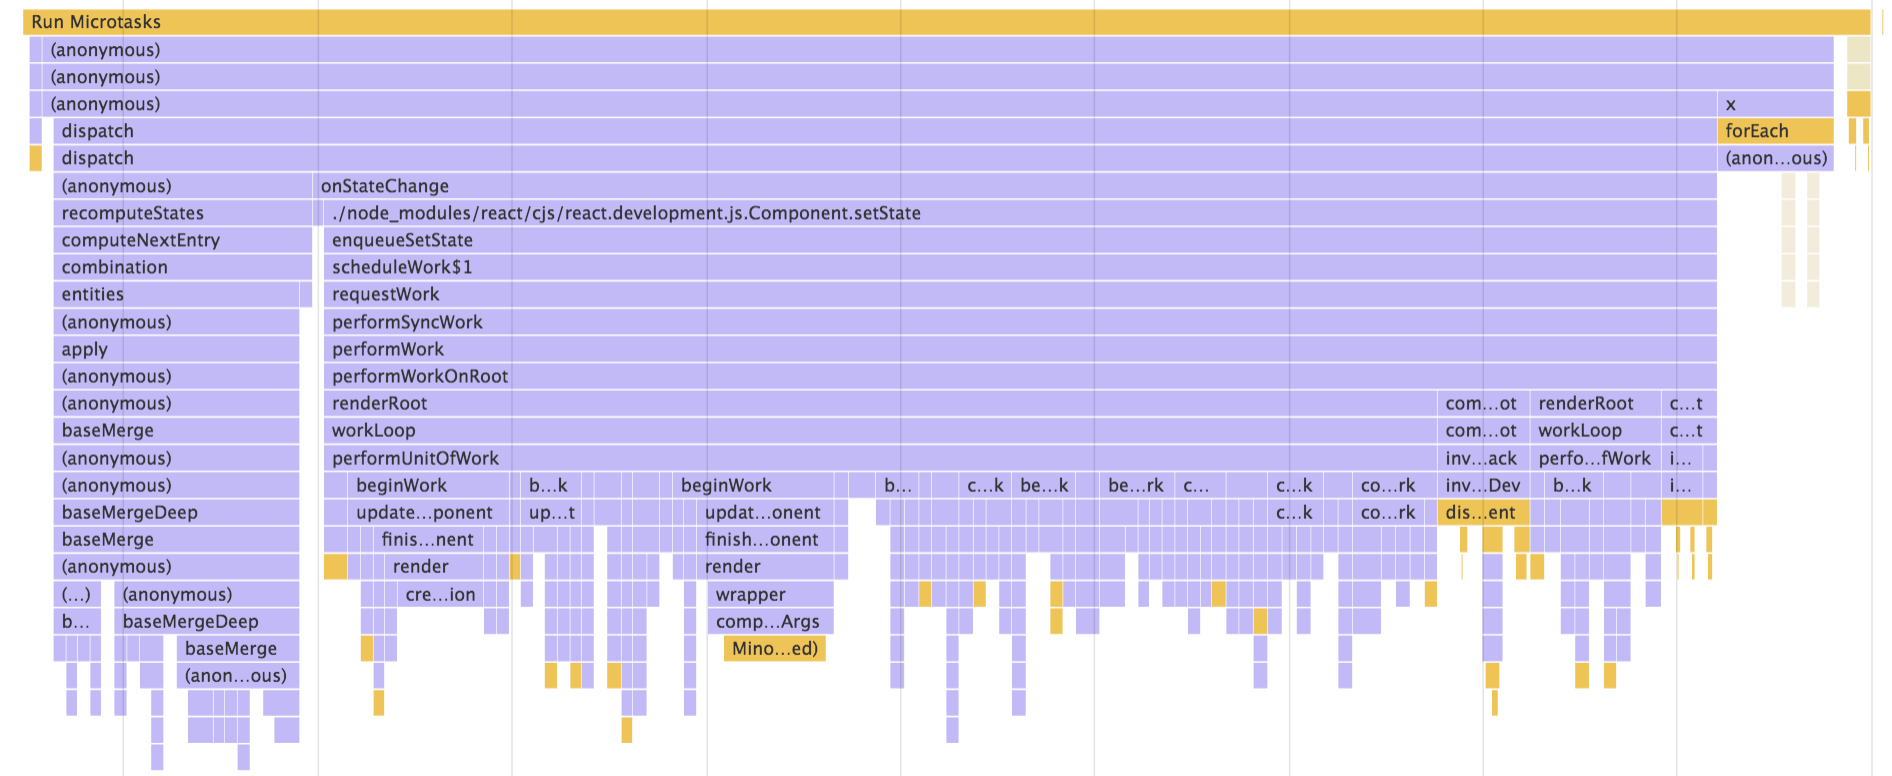
Most of the functions names there are coming from React. Functions like dispatch, recomputeStates, onStateChange, and performUnitOfWork don't go very far to help you determine what you can do to speed things up.
React's dev mode helps you out by hooking into the standard "user timing API" to tell you what components are associated with what parts of the flame chart. This can be immensely helpful for identifying what components are taking the most time to render, and give you a clear starting point for optimization.
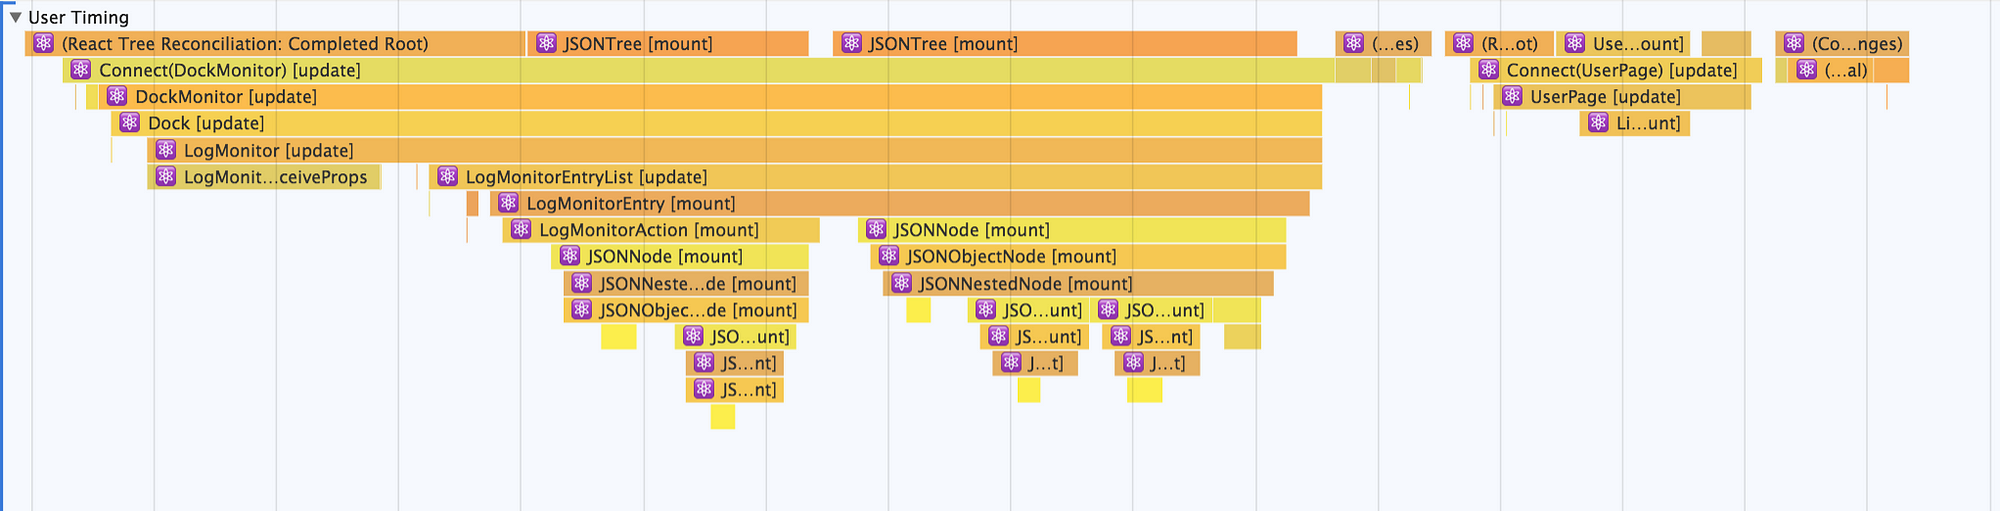
One detail that we don't get from there: What Redux action did we dispatch to trigger all those components mounting? I see Connect(DockMonitor) at the top of the list, so I could narrow down what parts of the state must be changing by looking at that component's mapStateToProps function, but I'd have to do more debugging to identify exactly what change is happening.
But as it turns out, there's a simpler way. I stumbled across a GitHub Gist showing an example of a middleware that ties Redux actions into the user timing API. My linter had some complaints and my Jest environment didn't provide the performance API, so I modified into the below form.
const userTiming = () => next => action => {
  if (performance.mark === undefined) return next(action);

  performance.mark(`${action.type}_start`);
  const result = next(action);
  performance.mark(`${action.type}_end`);
  performance.measure(
    action.type,
    `${action.type}_start`,
    `${action.type}_end`,
  );

  return result;
};
It's a regular middleware, so adding it to an existing project is easy. Add it to the list of middlewares being applied when you create the store.
applyMiddleware(/* middlewares, */ userTimingMiddleware);After running the performance profiler again, I can now see the action names logged in the user timing API!
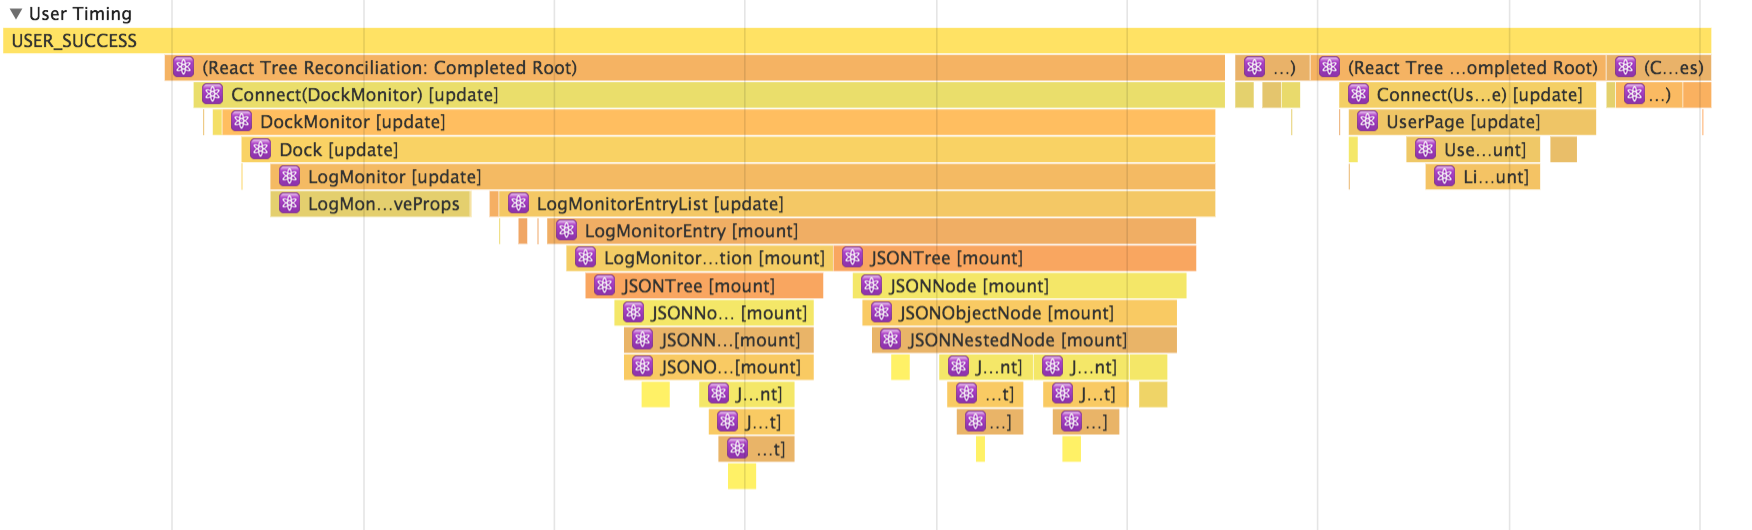
Awesome! It's now obvious what React components are being rerendered after any given action, which gives me an obvious place to look for actions that are particularly expensive or frequently run. A question that would have taken me a few minutes to answer is now trivially obvious. Go forth and profile!
Thanks for reading! I'm on Twitter as @vcarl_, and I moderate Reactiflux, a chatroom for React developers and Nodeiflux, a chatroom for Node.JS developers. If you have any questions or suggestions, reach out!